Quality profile
Whether you are analysing the data, reading about the research findings, or considering using the data for the first time, the Quality Profile provides information about all aspects of the design and implementation of Understanding Society that may affect the quality of the data resource.
How quality is built into the study
Understanding Society is built to provide reliable, relevant and transparent data. Quality is embedded at every stage of the survey — from questionnaire design to data release and user support
The quality of Understanding Society data is assessed across six key areas: relevance, accuracy, accessibility, interpretability, timeliness and coherence. These reflect how well the data meet user needs, how reliable they are, and how easy they are to access, understand and use:
- How useful is the survey for data users? (Relevance)
- How good is the quality of data collected? (Accuracy)
- How easy is it to access the data? (Accessibility)
- Which concepts and classifications schemes have been used? (Interpretability)
- What is the time period between data collection and data release? (Timeliness)
- How to maintain consistency with other similar survey data? (Coherence)
Framework
The Quality Profile is based on a framework developed by Lynn[1] (2001) for evaluating longitudinal surveys. It provides the information you need to assess the strengths of the study, highlights where there are limitations, and reassures you that the highest international standards have been used at all stages.
For each of these areas, the Quality Profile explains how the survey is conducted, the processes used to minimise errors and ensure quality, and where possible how those errors are measured. It also points you to further documentation for more detail.
[1] Lynn’s longitudinal framework was built on the framework developed for surveys by multiple survey and statistical organisations like Statistica Canada, UK’s Office for National Statistics, Eurostat and so on
Governance and management
Understanding Society is primarily funded by the Economic and Social Research Council (ESRC) and by a wide range of other co-funding organisations. The Study is managed, reviewed and safeguarded by co-investigators and led by the Team at the Institute of Social and Economic Research, University of Essex.
The core team is supported by external groups comprising expert stakeholders, including Topic Champions, Strategic Oversight Board, Data User Group, Policy and Partnership Forum, Participants Panel.
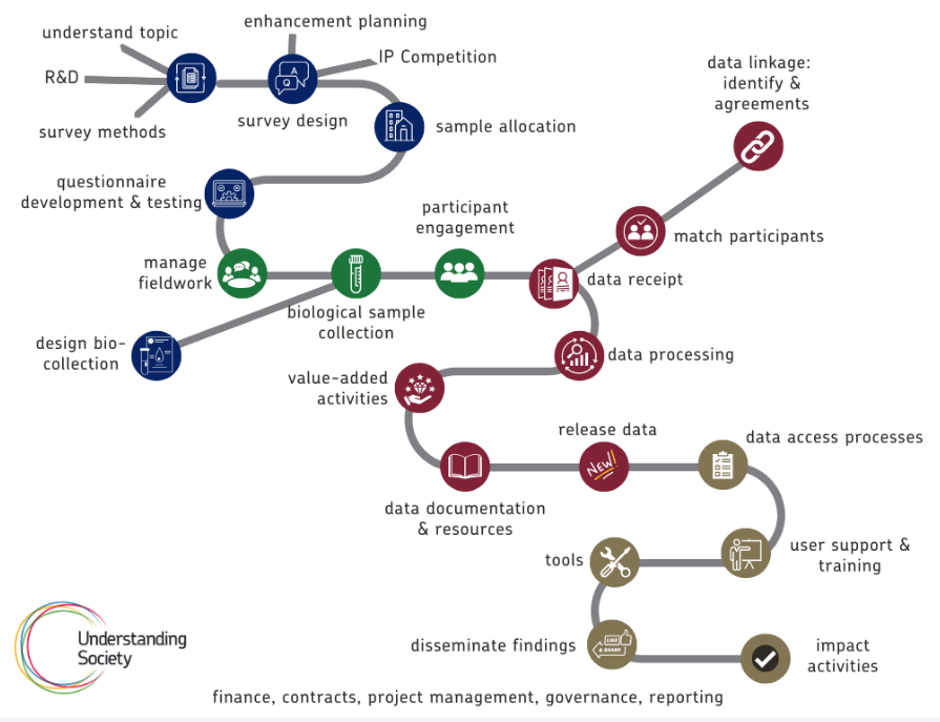
Work flow for Understanding Society
Choosing the right questions to ask – Relevance
Users of the Study comprise researchers, analysts and policy makers whose policies and findings impact the UK population. This section explores the data collected and how it meets the data needs of these stakeholders.
The choice of topics and questions included in the survey were initially developed through extensive consultation with stakeholders at multiple public events. Understanding Society is based on its predecessor, the British Household Panel Study (BHPS) which was fielded from 1991-2009. Through consultation, decisions were made on which core BHPS questions to retain to support long-term analysis since 1991, and which new topic areas to introduce to reflect contemporary British society.
Since the initial consultation, questionnaire content is continuously reviewed via a consultation process. Topics and questions that are no longer relevant are removed and new ones added. Changes to questionnaire content are never made lightly and content is only updated to reflect societal changes if it is of clear benefit to the Study and enriches the data for research. Changes are carefully managed to preserve longitudinal compatibility for researchers, with input from relevant topic experts and data users at every stage. Decisions are informed by a range of topic reviews and consultation exercises, some of which are highlighted below:
- Review of environmental attitudes and behaviour questions in the Understanding Society survey
- Improving questionnaire content for parents and families living apart
Ongoing consultation with academic and policy users is maintained through the Study’s Topic Champions and Policy and Partnership Forum. New suggestions are accepted via consult@understandingsociety.ac.uk.
Topic
The core areas of the study are family and households, employment, education, income and wealth, health and wellbeing. Secondary areas comprise all other aspects of an individual’s life such as politics, environment, digital lives, attitudes, beliefs and values. Explore these topics using our thematic index terms.
Topic suggestions are accompanied by suggestions of specific survey questions, which are then carefully assessed for design quality and suitability. New untested questions undergo pre-testing and piloting (see Section 1.3.5). Shortlisted questions are also evaluated in terms of interview time. Final decisions balance stakeholder priorities with the need to minimise respondent burden, as longer interviews can affect both response rates and the quality of responses.
To meet stakeholder needs while managing respondent burden, two main approaches are used. First, additional data collection methods that do not require respondents to answer questions are incorporated (see Section 1.3.5). This could take the form of linking survey data to external sources, such as health records (with respondent consent) and by asking additional linking information such as school names, vehicle registration plates and adresses. Full details are available on the data linkage page. New forms of data collection are also being tested, including the use of wearables and app-based data, such as Twitter/X (see Section 1.2.3). Second, rules are applied to control how often questions are asked and which respondents are included.
How good is the data collected?
Coverage error, sampling error, non-response
Every effort is made to correct for sampling error and non-response error using weights to adjust for unequal selection probabilities, differential nonresponse, and potential sampling error. Further details are provided on the Why use weights page in the user guide.
The sample design (see Section 2.3.1) shows that the survey covers individuals living in private households in the UK. The study does not cover the non-addressed based population.
Working paper series:
- Sample design for Understanding Society
- Design of the Understanding Society ethnic minority boost sample
- Design and implementation of a high quality probability sample of immigrants and ethnic minorities: lessons learnt
- View all publications for Sample design
Processes designed to reduce non-response and attrition
Participants receive mailings (by post and electronically) prior to receiving the questionnaires. Every effort is made to track and trace participants when they move or do not respond, including contact between fieldwork collection – known as inter-wave mailings (see interviewer instructions in the technical reports). Participants may also face language barriers; to aid response and reduce sampling error and attrition questionnaires are translated into multiple languages (to reflect the diverse sample) as well as offering incentives to all participants to respond. To reinforce the postal mailings, quarterly e-newsletters are sent to maintain communication and (re)engagement with participants and highlight the Study’s research findings. Participants can also find this information and contact the Study via the dedicated Participants website.
These processes are based on research, the results of which can be seen in the Understanding Society Working paper series:
- Maximising response in an address-based push-to-web survey: adjusting the communication and incentive strategies
- An initial look at non-response and attrition in Understanding Society
- Panel attrition in the General Population Sample and the Immigrant and Ethnic Minority Boost of Understanding Society
- View all publications for attrition, non-response and non-response and attrition
Instrument, interviewer and respondent error
As discussed in the section Methods Testing efforts are made to reduce instrument and respondent error to improve data quality.
Interviewers are provided extensive training and briefings about the questions and data collection specific to the upcoming wave. Interviewers receive briefings for each wave, including training for new interviewers and refresher sessions for experienced staff. Delivered by the fieldwork agencies, these briefings cover data collection procedures, fieldwork design, incentives, and approaches to participant engagement. Further details are provided in the Technical reports for each wave.
Advance mailings have been sent to households since Wave 1 to introduce the study and support interviewer visits. During face-to-face fieldwork, interviewers carried out household enumeration and encouraged residents to complete their individual interviews and self-completion questionnaires. For web interviews notes are added to help respondents answer the questions.
Mode effects guidance
Mode effects refer to the influence that different data collection modes can have on survey responses. Methodology researchers look at the impact of mode on data obtained from surveys.
In both the BHPS and Understanding Society data were collected in different modes, including face-to-face, telephone and web-interviewing. Full details of the modes used in each wave are available in the Interview process section in the User Guide. Along with the podcast Understanding data collection which talks about the different modes used for collecting interview responses. Using different modes during a survey can affect how respondents answer the same questions. The User Guide provides further information on the rationale for using mixed modes and provides analysis advice for mixed mode data.
Working paper series:
- Clarke and Bao (2022)
- Mode effects
- Understanding Society: minimizing selection biases in data collection using mobile apps
- View all publications for mode effect
Consistency across waves witin this survey
Within the survey, continuity is maintained by asking repeated questions in a consistent way across waves, using the same wording, routing and context wherever possible. This supports reliable longitudinal analysis.
The full schedule of questionnaire content is set out in the Long-term content plan which shows core and rotating topics, how they are collected over time, and future planned questionnaire content.
Changes to questionnaire content are never made lightly and content is only updated if it is of clear benefit to the Study and enriches the data for research. For example, to accommodate societal change, a change in policy, or the introduction of new modes of data collection. Any changes to questions are reviewed, tested and validated by the appropriate topic experts to ensure continuity is preserved.
Further details and examples are provided on the Changes to the questionnaire and questions section in the User Guide.
Internal longitudinal data checks are conducted for key information, such as date of birth, relationships and so on. This supports reliable longitudinal analysis.
Checking for data quality and errors
Understanding Society applies a structured six-stage quality assurance process (V1–V6) before data and documentation are released to users. Further details are available in the Understanding data processing podcast.
Data are supplied quarterly by the fieldwork agencies. Early stages (V1–V3) focus on data processing, cleaning and data quality checks. These include checks to maintain consistency over time, such as verifying key stable characteristics (for example age, gender and relationships between household members) to ensure individuals are correctly linked across waves.
Later stages add value to the data. This includes the production of derived variables, coding of free-text responses (such as occupation using standard classifications like SOC and SIC), and the creation of survey weights and income variables. Income measures include processes such as imputation (to address missing responses) and top-coding.
Imputation is used where a respondent is either missing an individual interview (unit non-response) or does not provide an answer to a particular income question (item non-response). Survey weights are applied to adjust for unequal selection probabilities and differential non-response, helping to improve representativeness in the population. Further details are available in the Why use weights page and the podcast Understanding weighting (see also Representing the population). Derived variables are created to control routing through the questionnaire and post fieldwork, for example, derived additional occupational classification using socio economic classifications such as SEG. For details on the quality check performed on the data see the document produced by John and Memo
Quality assurance continues beyond processing. Prior to each data release, the Data User Group (DUG) reviews the V3 data and provides feedback across topic areas. The group consists of experienced users from a range of disciplines.
Data issues are also identified by users and reported via the User Support Forum to the data team. Until resolved these issues are documented in the variable notes of the online variable search. Updates and corrections are then incorporated into subsequent releases and recorded in Revisions to previous releases in the User Guide.
Indicators to show data quality
To increase sample sizes and population representativeness, a general population boost sample (GPS2) was added at Wave 14. The quality of data collected from both continuing and boost samples was assessed in the Wave 14 Boost Data Quality Indicators report, using the European Statistical System’s five dimensions of quality.
How easy is it to access the data?
Data are made available to users while safeguarding the confidentiality of participants.
Data, disclosure risk and data security
Ensuring that data are easy to access is a primary goal of the Study, but this is balanced with the need to protect participant confidentiality and their data. Participants are made aware that they do not have to participate in the interview, can stop the interview at any time, and can request removal of their data at any time (with the proviso that data already released cannot be removed).
Before data are released, a range of measures are taken to protect the confidentiality of participants. First, directly identifiable disclosive information such as names, addresses and any verbatim responses are removed from the data made available to data users. During this process access to this information is restricted to a specific number of authorised team members only.
Second, any relevant information from these types of data is converted into non-disclosive coded data. For example, addresses are used to identify levels of geography such as Regions (formerly, Government Office Regions), LSOA, Parliamentary constituencies etc.
Verbatim reports such as countries of birth or ethnic group are coded back into the original response options for that question or ‘Other’ category where applicable. While verbatim reports about the job and workplace are converted into codes based on established classification coding frameworks.
Third, the rest of the data is evaluated for the degree of disclosure risk. Minimisation of this requires special access for more sensitive data. Depending on the level of disclosure risk, data are made available under different access conditions, with progressively stricter safeguards: End User Licence (EUL), Special Licence (SL), and Secure Access Data (SA).
Data access
Access is managed to ensure that data remain both accessible and are responsibly used by analysts. Researchers must register with the UK Data Service and are required to read the UK Data Service Research Data Handling and Security: Guide for Users before downloading the data. Access to EUL data requires agreement to these conditions. Access to SL data requires an application explaining the research purpose and justification for use; access is granted once the application is vetted. Access to SA data requires an application and additional training and accreditation before being granted access to the data. Data access is much stricter and can only be used within a Trusted Research Environment (TRE). Any publicly shared outputs are reviewed and vetted before being released to the data user.
Full details of each level of access are provided on the page Access levels explained with the overall approach to access, principles and guidance outlined in Understanding Society Data Access Strategy. Access guidance is regularly updated to reflect changes in the research and analysis environment, including the use of AI and cloud-based tools, with supporting information provided in updated FAQs.
How easy is it to use the data?
We provide clear guidance and resources to help users understand and interpret the data.
Finding information about the Study
Resource pathways are designed to help different types of users quickly find the information they need, ranging from introductory guidance to more advanced information. They support a range of users, including those working with social science and life science data, as well as policy-focused audiences.
Topic pages
Topic pages provide information about data collected for each topic, along with links to related survey questions and index terms to support focused topic searches.
User Guides, Glossary and FAQs
These resources help users understand the data, how it was collected, the meaning of key terms and measures, and provide answers to frequently asked questions. Additional datasets are described in their respective user guides.
Variables search
Understanding Society includes a large number of questions and associated variables. The Variable search provides multiple ways to find and explore the data, including searching by variable name, data file, index term, or question module.
The search tool also links questions, variables and data files, helping users navigate between them. In addition, users can search by topic to identify key variables for analysis or use hierarchical index terms to find related variables and data.
Topic-focused introductory webinars are held throughout the year, providing guidance on key topic areas of the Study.
Helping users to analyse the data
A wide range of resources are available to support data analysis, including:
- The Code creator: Create your own Stata and R code to extract data from the main End User Licence Understanding Society dataset.
- Data management syntax files – Understanding Society
- User deposited syntax – Understanding Society
- Variable naming convention – Understanding Society
- Training – Understanding Society
- Self-paced training with tools for data management
- In-person training (Introductory, Intermediate & Advanced)
- User Support: Contact us at the User Support Forum or by email. We respond within 48 hours for simple issues, 7 working days for more complex issues.
- Usage statistics: Understanding Society Annual Report
- Help for lecturers: Teaching datasets – Understanding Society
Helping analysts by adding value to the data
Valued added work is performed on the data. Income variables are imputed and derived, survey weights are produced and free text is coded. These derived variables are included in the datasets along with supporting syntax to help users work with the data. This includes employment history derived syntax created by users.
Further details are provided in the User Guide, including sections on Derived variables, Derived income variables and survey weights.
Additional datasets
Additional datasets are explained in their specific user guides:
- Calendar year datasets
- Partnership history dataset available
- Fertility history dataset (GGP dataset)
- Pregnancy and early childhood – Understanding Society (PEACH)
- Family matrix file is included in the main survey data
How quickly is the data released after it is collected?
We provide our main datasets within six months of the end of data collection.
The Data releases page contains the latest information on available datasets and upcoming releases.
The Survey Evolution timeline shows when each sample was added to the study. The fieldwork dates (including day and month) are listed on the Survey timeline page of the User Guide.
How we maintain consistency with other similar studies
Understanding Society maintains consistency with other studies in several different ways.
Consistency across surveys
We are part of a world-wide group of household panel studies. Details of these studies are available on our website.
Advisory boards
Understanding Society team members serve on advisory boards for other similar studies, while researchers from those studies also contribute to our advisory board, allowing us to share knowledge and learn from this collaborative process. Comparable panel studies include the Japanese (JHPS)/(KHPS), Korean (KLIPS), South African (NIDS), and Chinese (CFPS) surveys.
Partner organisations
We work closely with partner organisations, including CLOSER, National Centre for Research Methods (NCRM), Data and Research Training Network (DRTN), Research Capacity Hub (RCH) and the UK Data Service, both in an advisory capacity and to develop and deliver training, user support and communication activities. This collaboration helps to strengthen the resources and support available to data users and ensures alignment with wider research practices.
The user developed Comparative Panel file (CPF) project enables international comparisons between seven of these studies.
How good is the data collected in the Quality of data section details how continuity and consistency within the survey and across waves is maintained to support reliable longitudinal analysis