Understanding Society is a panel survey of UK households with yearly interviews.
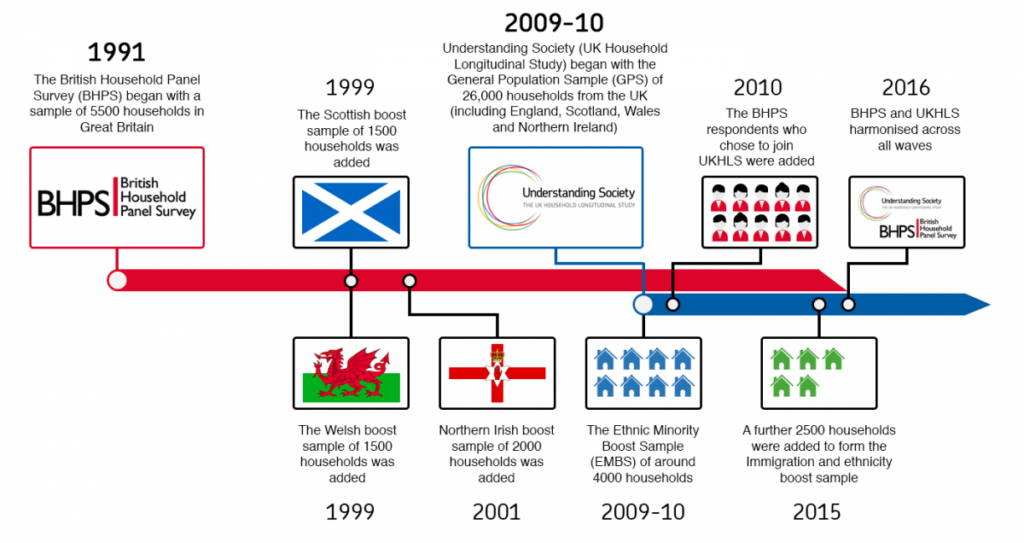
The Study began in 2009-10. The overall Study has multiple sample components to enable research of different sub-groups over time and location or geography:
- The General Population Sample (GPS): (i) a clustered and stratified, probability sample of approx. 24,000 households living in Great Britain in 2009-10 (ii) a simple random sample of approx. 2,000 households living in Northern Ireland in 2009 (selected with twice the selection probability as the Great Britain part) See Sample design for Understanding Society.
- The Ethnic Minority Boost Sample (EMBS): approx. 4,000 households selected from areas of high ethnic minority concentration in 2009-10 where at least one member was from an ethnic minority group. See Screening questions Appendix III and sample design paper – Design of the Understanding Society ethinic minority boost sample.
- The Immigrant and Ethnic Minority Boost Sample (IEMBS), added in Wave 6:approx. 2,900 households selected from areas of high ethnic minority concentration in 2015 where at least one member was born outside the UK, or from an ethnic minority group. See Screening questions Appendix III and sample design paper – Design and implementation of a high quality probability sample of immigrants and ethnic minorities: lessons learnt.
- The British Household Panel Survey sample (BHPS), added in Wave 2: approx. 8,000 households from the BHPS sample.
What are the different Samples?
This video gives an overview of the sample design for Understanding Society and how to account for it in analysis.
A more detailed discussion and further reading can be found in the survey’s sample design document.
Listen to Peter Lynn Deputy Director of ISER talk about how participants are selected to take part in the Study and the importance of longitudinal data.
Survey sampling:
Tips for analysts:
Analyse all samples that are available together. As the data for all samples are provided in the same data file, as long as you don’t explicitly exclude a sample you will be doing this by default. You can analyse the GPS by itself, but it will mean your sample size will be smaller than if you were using all samples and there will not have large enough samples for ethnic minority and immigrant groups. If you use any of the boost samples by themselves then your analysis will not include a representative sample and suffer from coverage error.
While the samples are probability samples, not all sections of the population were selected with the same probability. Also, not everyone selected and asked to participate in the interviews did so. To correct for bias due to these two reasons we recommend you use the weights provided. TIP: This is explored in the weighting and sampling section.
All samples other than the GPS-NI part had a clustered and stratified design. As statistical softwares assume that the data is simple random sample, to estimate standard errors correctly you will need to explicitly inform the software about the clustering variable w_psu (primary sampling unit) and the stratification variable w_strata. For guidance on this visit the Clustering and stratification page.